WHY? WHY? WHY? Why Markets are Falling and Rising
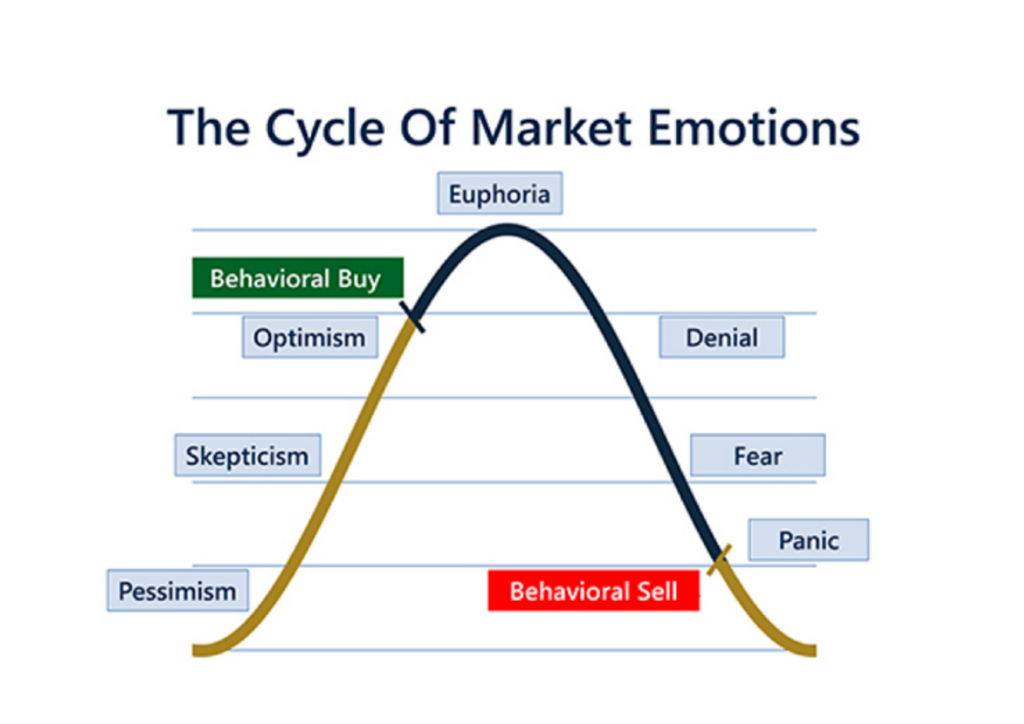
Out of ~8.2– 8.3 billion people globally, nearly 6 billion are adults yet only around 500 million(~6% of population) invest in markets. Top 1% owns ~44% to 46% of global wealth This highlights how disciplined investing remains a powerful advantage. Markets, like the ocean, go through natural ups and downs. This movement is healthy and […]
Update On Global Turmoil and Opportunities

Over the last 12 months, markets and commodities have delivered results that no one expected. Asset/ Market Approx. Return (%) 1 year Return Asset/ Market Approx. Return (%)1 year Return Gold +70% to +75% China (CSI 300) +18% to +20% Silver +148% to +150% US Market (S&P 500) +16% to +18% MCX Copper (India) +60.0% […]
NOW WHAT? A Simplicity Perspective of What’s Next
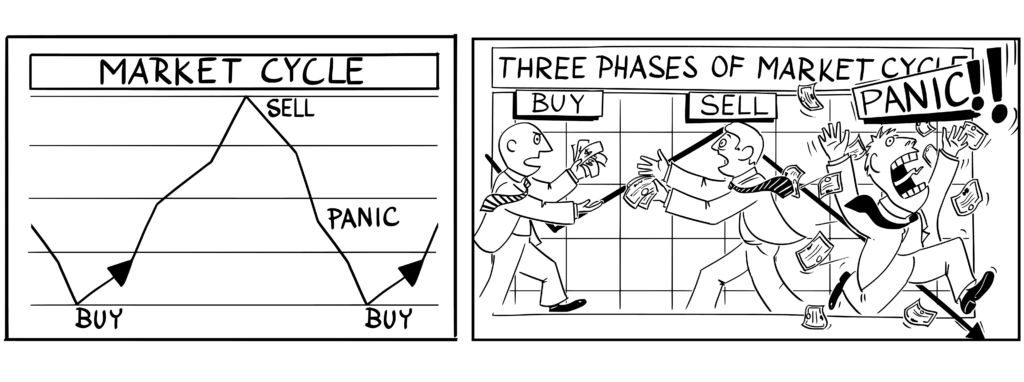
The Budget is behind us, the Tariff deals are signed, and the initial euphoria over Gold and Silver has leveled off, and even global uncertainty seems to have caught its breath. So, now what? History shows us that “bad news” is a constant visitor; it arrives, causes a stir, and eventually leaves. While the headlines […]
Why Indian Equity Markets Will Outperform The Global Markets

The global equity market totals US$132.5 trillion, equities form about 14% yet they remain the most transparent and real-time barometer of global economic strength. India is the 4th Largest Equity market in the world and contributes 4.4% approx 5.5 trillion USD. The top ten countries account for nearly 80% of the entire equity market.In 2025, […]